Demand Forecasting
Predict future demand patterns with multi-horizon probabilistic forecasting, reducing stockouts while minimising excess inventory.

Most ML investments underperform. The cause is rarely the algorithm; it is problem formulation, progression strategy, and production engineering. The gap between a model in a notebook and a system whose value accrues is where expertise matters most. Right-size the solution to the problem, start where the data supports it, advance when the numbers justify it, engineer for production from day one.
Production ML systems operate across every dimension of enterprise performance. These archetypes represent the breadth of what the discipline delivers at scale. Each one rests on the same three engineering disciplines.
Predict future demand patterns with multi-horizon probabilistic forecasting, reducing stockouts while minimising excess inventory.
Optimise pricing strategies in real-time based on demand, competition, and market conditions to maximise revenue and margins.
Recommend optimal customer actions using predictive analytics to increase conversion rates and customer lifetime value.
Automate visual inspection and quality control processes with AI-powered image analysis and defect detection.
Identify unusual patterns and outliers in real-time to detect fraud, system failures, and operational issues before they escalate.
Finance-aware gas field production optimisation that maximises profits while maintaining gas quality.
Every successful ML deployment shares three disciplines. They determine whether a project delivers lasting business value, or produces a result that looks impressive in a demo yet fails to change decisions in the real world.
A retailer asking which products will sell most next month needs a forecast. One asking which customers are most likely to leave needs a score. These are different questions requiring different methods, and the right starting point is always the business question, never the algorithm that happens to be on hand. Getting this right means every output maps directly to a decision someone in the business can act on.
A logistics company achieved faster results, and better accuracy, from a well-tuned forecasting model with clean data preparation than from a complex neural network that took three times as long to build. Sophistication earns its place only when simpler approaches have been tested and found wanting. Complexity without justification is time and budget that could have delivered value sooner.
A fraud detection model showed excellent results in testing but eroded within weeks of deployment, because the fraud patterns it learned were no longer the ones appearing in live transactions. Models built for production include the monitoring, update mechanisms, and operational safeguards to sustain performance over time, not just at launch.
Problem-First Navigation
Almost every business challenge has an analytical solution: the question is which one fits best. Starting from the business problem ensures the highest-value opportunities get priority, simple problems don't get over-engineered, and every solution is deployed at the right level of complexity and speed. A retailer prioritising demand accuracy selects differently from a bank managing credit risk, even if both end up using similar model families. The framework below maps your actual business issue to a formal problem class and the appropriate model families.
The difference between ML that demonstrates capability and ML whose value accrues comes down to how you approach the problem. Complexity must be justified by the data that supports it, the business value it unlocks, and the feasibility of sustaining it across infrastructure, skillsets, and delivery timelines.
Proven, interpretable methods: logistic regression, rule-based systems, classical time series. Deployed in days to weeks. Establishes the performance floor and earns stakeholder trust. Many problems are fully solved here. Feasibility is high: minimal data requirements, fast inference, no specialist infrastructure, and maintainable by analysts without ML engineering depth.
Gradient boosting, engineered features, semantic search. Deployed in 4–8 weeks. Captures non-linear patterns that baselines miss and is the workhorse tier for most production systems. Feasibility is moderate: requires sufficient labelled data, standard compute, and a data science team comfortable with experimentation and feature engineering. Inference latency suits most batch and near-real-time requirements.
Temporal transformers, graph neural networks, causal inference. Deployed when standard methods plateau and the business case justifies it. Reserved for high-value problems with complex dependencies. Feasibility demands careful evaluation: substantial data volume, GPU/TPU compute for training, specialist ML engineering, and a business return that clears a higher infrastructure and talent investment bar.
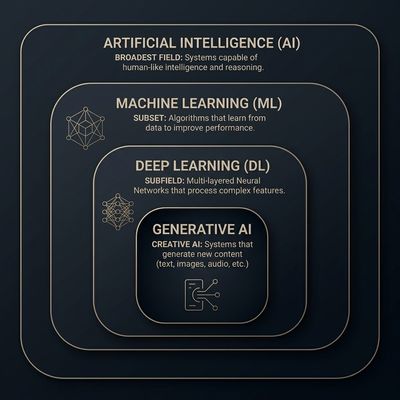
GenAI reasons over language. ML makes numerical decisions: fast, cheap, and the same way every time. The choice between them is structural, never a matter of preference.
Use ML when the outcome space is closed and well-characterised: deterministic outputs, or sub-100ms latency, or auditable decision logic, or cost-per-inference in fractions of a cent.
A freight pricing system processes two million rate quotes per day. Each must return in under 50ms. A gradient-boosted model scores on acceptance history, competitor rates, and capacity utilisation. The result: 8% margin improvement, full auditability for contract disputes, and inference cost three orders of magnitude below what a foundation model would require for the same task. GenAI cannot match this on speed, cost, or reproducibility, and it does not need to. The problems are different.
Your ML Toolkit
The business problem framework above maps your issue to a problem class. The following reference covers what each algorithmic discipline actually does, how solutions evolve from baseline to advanced, and when the investment in advancement is warranted. Use it to understand what you're selecting, and why.

Predicts numeric outcomes and future values so you can plan and manage performance using forward-looking numbers rather than rear-view reports.
Uses historical relationships between input drivers such as price, spend, volume, or external factors and numeric outcomes to estimate expected values or full forecast paths for new scenarios and future periods.
Consider this when decisions depend on quantities like volume, spend, or risk level and small errors in those numbers have material financial or operational consequences.

Predicts which category a customer, transaction, or decision falls into so you can treat high-, medium-, and low-risk or high- and low-value cases differently.
Uses supervised learning on labelled examples to estimate the probability that each new case belongs to each class, such as approve or decline, churn or retain, or fraud or legitimate.
Consider this when many similar decisions are made every day, outcomes vary by who reviews them, and you want consistent, data-driven decisions at scale.

Groups customers, products, or behaviours into segments so you can tailor offers, experiences, and analysis to how different groups actually behave.
Uses similarities in characteristics or behaviour to discover groups without pre-defined labels, often reducing complex data into a small number of meaningful segments.
Consider this when one-size-fits-all strategies underperform and you need differentiated treatment for groups that behave very differently.

Automatically detects unusual events or behaviours so issues can be investigated before they turn into major incidents or losses.
Learns what normal patterns look like across many metrics or entities, then flags new observations that deviate significantly from this baseline as potential anomalies.
Consider this when you monitor many signals at once and important issues are either missed entirely or buried in a high volume of noisy alerts.

Tests what-if scenarios and finds good allocations of limited resources so you can balance cost, service levels, and risk under real-world constraints.
Uses mathematical optimisation and scenario simulation to search across many possible decisions and identify those that best satisfy business objectives and constraints.
Consider this when you face complex trade-offs across cost, service, and risk, many constraints must be respected, and manual scenario analysis can no longer cover the decision space.

Understands and generates natural language so you can automate knowledge work, surface insights from text, and provide more intelligent customer and employee experiences.
Uses language models to convert text into structured representations for search and prediction, and to generate summaries, answers, or drafts based on your content and instructions.
Consider this when large volumes of text slow teams down, answers are locked in documents, or you want to automate repetitive language-heavy tasks while keeping humans for review.

Models relationships and locations so you can understand networks, flows, and spatial patterns that drive risk, opportunity, and service levels.
Represents entities and their connections as graphs, and locations as points or regions, then uses structure and distance to score risk, influence, similarity, or accessibility.
Consider this when risk or value depends on who or what is connected to whom, or where things are located, rather than only on individual attributes.

Combines signals from text, images, audio, and tabular data so you can build richer views of customers, products, and operations than any single data type can provide.
Uses representation learning to encode different data types into compatible vectors, then fuses them in models that can reason across multiple modalities at once.
Consider this when important context sits in multiple data types and single-source models miss patterns that only emerge when signals are combined.
Prediction accuracy is necessary but not sufficient. When decisions affect customers, regulators, or capital allocation, the model's reasoning must be inspectable. Explainability is the bridge between a model's output and the human judgement that acts on it, and an organisational prerequisite for building trust in ML at scale.
For any individual prediction (why was this loan application declined, why was this transaction flagged, why was this customer scored high-risk), attribution methods distribute the model's output across its contributing factors. Each factor is quantified and ranked. Lending officers, fraud analysts, and customer-facing teams can read, challenge, and act on the reasoning. This is the foundation for responsible deployment in regulated and high-stakes environments.
Beyond individual predictions, organisations need to understand what a model has learned overall. Which inputs drive the most decisions? Under what conditions does performance degrade? Does the model treat different customer segments consistently? Global transparency supports regulatory review, surfaces unintended bias, and validates that the model has learned from the right patterns, not spurious correlations in the training data.
Some decisions require explanations that are intrinsic rather than post-hoc. Rule-based systems, scorecard models, and decision trees are transparent by construction — their logic is the model. The right choice between an inherently interpretable model and an explained black box depends on regulatory requirements, the stakes of each decision, and the performance tradeoff the organisation is willing to make. Both are valid; neither is a default.
The other half (feature engineering, serving infrastructure, monitoring, governance) determines whether a model gains value or decays. Production ML engineering is the discipline that separates deployed models from production systems.
Feature stores, experiment tracking, and model registries: the foundation that turns notebooks into deployable, maintainable systems.
Real-time and batch architectures matched to latency requirements, with safe rollout mechanisms that eliminate deployment risk.
Drift monitoring, automated retraining, and governance that keeps models performing as the world changes around them.
Feature stores ensure consistent feature computation between training and serving environments, eliminating training-serving skew, one of the most common causes of production performance degradation.
Experiment tracking captures every model run with parameters, metrics, and artifacts, making the best-performing version reproducible and auditable. Model registries version and govern artifacts with the metadata required for deployment approvals and rollback.
Together these form the engineering layer that makes iteration systematic instead of ad hoc - the difference between a team that can improve a model reliably and one that recreates work from scratch each cycle.
Real-time serving (sub-100ms) requires optimised inference pipelines, model caching, and horizontal scaling matched to traffic patterns. Batch serving for daily scoring, weekly aggregations, and large-scale operations uses different infrastructure optimised for throughput over latency.
Champion-challenger deployment runs a new model alongside the current production model simultaneously. Only when the challenger demonstrates consistently superior performance does it become champion. This eliminates the high-risk big-bang deployment approach.
Fallback strategies ensure graceful degradation when primary models fail: rule-based fallbacks, cached predictions, or ensemble averaging. The serving layer determines whether a well-built model reaches business users reliably.
Data drift occurs when the distribution of input features shifts from what the model was trained on. Concept drift occurs when the relationship between inputs and the outcome changes - fraud patterns evolve, consumer behaviour shifts, market conditions change.
Automated monitoring detects both continuously, triggering alerts before business impact is visible in downstream metrics. Retraining pipelines activate when performance falls below agreed thresholds, eliminating the manual refresh cycle that causes most production degradation.
Model cards document performance characteristics, known limitations, and appropriate use conditions. Audit trails satisfy regulatory requirements. The sustain layer is what separates an ML system from an ML experiment: it determines whether value accrues or erodes.
Which opportunities are ready for production. Which need infrastructure first. Which are better served by GenAI. And which will define your competitive position in three years.